Statistics is the field that most people encounter in school, fail to internalize, and then desperately need when they enter a field that requires evidence-based thinking. Data scientists need it to interpret model outputs. Medical researchers need it to design trials. Engineers need it to analyze system performance. Economists need it for inference. Almost everyone who works with data needs statistics, and most people who were taught it in a classroom left without understanding what they were doing.
YouTube has partially solved this problem. The combination of StatQuest's visual explanations, 3Blue1Brown's geometric intuition, and freeCodeCamp's practical coding tutorials has made statistics accessible to self-learners in a way that textbooks alone never managed. The concepts that were opaque in a lecture hall become clear when Josh Starmer draws a probability distribution by hand and explains what each part of it means.
This guide is a structured roadmap to learn statistics from YouTube. It covers the full progression from probability through regression, the specific channels and playlists that are worth your time at each stage, how to make the math stick through practice, and the connections to applied work that keep the subject from feeling purely academic.
Start here — StatQuest's introduction to statistics is the best entry point on YouTube:
For the mathematical context that underpins probability and statistics, the learn calculus from YouTube and best YouTube channels for math guides are natural companions. For the applied use of statistics in data science work, the learn data science from YouTube roadmap is the continuation.
Why Statistics Is Hard to Learn and Why YouTube Helps
Statistics is conceptually harder to learn from a textbook than most mathematical subjects. The reason is that statistical concepts have both a formal definition and an intuitive meaning, and the two are often expressed in language that sounds similar but is not the same thing. A p-value has a precise definition that sounds completely different from what most people think it means. Confidence intervals are routinely misinterpreted even by people who use them professionally. Correlation being not causation is repeated so often that it has become a cliche, but most people cannot explain concretely why the distinction matters in a specific case.
YouTube helps because the best statistics instructors on the platform (StatQuest above all) build the intuition first. They use animated graphs, hand-drawn diagrams, and worked examples to show what a concept means before introducing notation. By the time the formula appears, you already understand what it is computing and why. This is the opposite of how most statistics textbooks work, which introduce the formula and then (if you are lucky) explain what it means.
The other reason YouTube helps: you can pause and rewind. Statistics is full of moments where a single sentence carries enormous information. "The p-value is the probability of observing data at least as extreme as the observed data, assuming the null hypothesis is true" — you can read that sentence in a textbook and move on without absorbing it. On YouTube, you can pause, think, replay, and hear the explanation two or three more times in different words.
Stage 1: Descriptive Statistics (Making Sense of Data Before You Model It)
Goal: understand how to summarize and describe a dataset numerically and visually. Know what the numbers you produce actually mean.
StatQuest — Statistics Fundamentals playlist is the correct starting point. Josh Starmer opens with the mean, variance, and standard deviation, then moves through histograms, probability distributions, and the normal distribution. Each video is 10–20 minutes and uses the same visual approach: graphs built up piece by piece, with constant verbal explanation of what each element represents.
Topics covered in this stage:
- Measures of central tendency: mean, median, mode. The mean is sensitive to outliers; the median is robust. When to use each depends on the distribution of your data.
- Measures of spread: variance, standard deviation, interquartile range, range. The standard deviation is the average distance from the mean — but only for normal-ish distributions does this intuition hold.
- Distributions: the normal distribution (the bell curve), why it appears so often (the Central Limit Theorem), and why assuming normality without checking is a common mistake.
- Percentiles and quartiles: the 25th, 50th, and 75th percentiles divide the data into four equal parts. Box plots visualize these and reveal skewness and outliers at a glance.
- Skewness: a distribution is right-skewed if the tail is longer on the right (income distributions typically are). Left-skewed if the tail is longer on the left. Skewness matters because many statistical tests assume symmetry.
Practice: load a real dataset in Python (or even Excel) and compute every descriptive statistic covered in this stage. The Kaggle datasets page has hundreds of free datasets. Choose something with variables you understand — sports statistics, city populations, weather data — so you can sanity-check whether the numbers make sense.
Stage 2: Probability (The Language Statistics Is Written In)
Goal: understand probability as a formal framework for reasoning under uncertainty. Connect probability to the statistical tests you will use later.
StatQuest — Probability playlist covers discrete probability, conditional probability, Bayes' theorem, and probability distributions. The video on Bayes' theorem is the clearest explanation of that concept available for free — Josh uses the example of a medical test with a known false positive rate to show why the prior probability matters enormously when interpreting a positive result.
3Blue1Brown — Bayes' Theorem is a different approach to the same concept and is worth watching alongside StatQuest. Grant Sanderson's visual approach (using area diagrams to represent probabilities) makes the formula feel inevitable rather than arbitrary.
Topics to cover:
- Basic probability: sample spaces, events, probability as frequency, the sum and product rules.
- Conditional probability: P(A|B) — the probability of A given that B has occurred. The foundation of Bayesian reasoning and many statistical tests.
- Bayes' theorem: P(A|B) = P(B|A) × P(A) / P(B). How to update beliefs given new evidence. Used in spam filters, medical diagnosis, and (fundamentally) Bayesian statistics.
- Independence: two events are independent if knowing that one occurred does not change the probability of the other. Independence is a mathematical property, not an intuitive one — variables that seem unrelated can be statistically dependent.
- Common distributions: the normal, binomial, Poisson, and exponential distributions. Each models a different kind of process. The binomial models counts of successes in binary trials. The Poisson models counts of rare events in a fixed time window. The exponential models waiting times.
The Central Limit Theorem: arguably the most important result in statistics. If you take repeated samples from any distribution (not just normal) and compute the sample mean, those sample means will be approximately normally distributed — and the approximation improves as the sample size grows. StatQuest's video on the CLT is excellent. This theorem is why so many statistical procedures that assume normality still work reasonably well in practice.
Stage 3: Inferential Statistics (From Sample to Population)
Goal: learn to make defensible claims about populations based on sample data. Understand the machinery of hypothesis testing — and its limits.
This is the most conceptually difficult stage and the one where the most misunderstanding lives. The widespread misuse of p-values is not a misuse by people who never studied statistics — it is a misuse by people who learned statistics in a way that left them with incorrect intuitions.
StatQuest — Hypothesis Testing series is the roadmap through this material. The videos on p-values, t-tests, chi-squared tests, and ANOVA are each thorough and visually clear. Watch them in order.
The p-value, stated precisely: a p-value is the probability of observing data at least as extreme as the observed data, given that the null hypothesis is true. It is not the probability that the null hypothesis is true. It is not the probability that the result is due to chance. It is not an indicator of effect size. These misstatements are common and they lead to bad decisions.
What this stage covers:
-
The null hypothesis and alternative hypothesis: the null hypothesis is the conservative claim you are trying to disprove (usually "no effect" or "no difference"). The alternative is the claim you are trying to support. Statistical tests evaluate the evidence against the null.
-
Type I and Type II errors: a Type I error (false positive) is rejecting the null hypothesis when it is true. A Type II error (false negative) is failing to reject the null when it is false. The significance level α controls the Type I error rate. Statistical power controls the Type II error rate.
-
t-tests: compare the means of one or two groups. One-sample t-test, independent samples t-test, paired samples t-test — each appropriate for different data structures. StatQuest covers all three.
-
ANOVA (Analysis of Variance): extends the t-test to more than two groups. Tests whether at least one group mean differs from the others without inflating the Type I error rate by running multiple t-tests. Post-hoc tests (Tukey's HSD, Bonferroni) identify which groups differ.
-
Chi-squared test: tests whether two categorical variables are independent. Used for count data: are men and women equally likely to prefer product A over product B? Is disease incidence independent of region?
-
Multiple testing problem: if you run 20 hypothesis tests at α = 0.05, you expect one false positive by chance. Bonferroni correction and the false discovery rate are the standard approaches to this problem.
zedstatistics (Justin Zeltzer) is an underrated channel that covers hypothesis testing and ANOVA in more mathematical depth than StatQuest. If StatQuest's intuitive style leaves you wanting more rigor, zedstatistics is the complement.
Stage 4: Regression Analysis (The Most Used Statistical Tool)
Goal: understand linear regression and logistic regression as statistical procedures, not just ML algorithms. Know the assumptions, how to check them, and what violations mean.
Regression is both a data analysis tool and the foundation of most machine learning algorithms. Most YouTube tutorials treat regression as an ML technique and focus on fitting a model with scikit-learn. This stage treats it as a statistical procedure — which means understanding the assumptions that justify the inferences you draw from it.
StatQuest — Linear Regression series covers the statistical treatment of linear regression: the assumptions (linearity, homoscedasticity, normality of residuals, independence), how to check them with diagnostic plots, and what to do when they are violated. This is the treatment you do not get from ML tutorials.
Brandon Foltz — Statistics series on YouTube covers regression in exceptional depth. Brandon's explanations of the sum of squares, the F-statistic, and the interpretation of coefficients in multiple regression are among the clearest available. His series is appropriate after StatQuest if you want more mathematical detail.
Topics:
-
Simple linear regression: fitting a line to two variables. The least squares criterion, interpretation of the slope and intercept, R-squared as a measure of explained variance.
-
Multiple linear regression: extending to more than one predictor. Multicollinearity (when predictors are highly correlated with each other) inflates standard errors and makes coefficient interpretation unreliable. Variance inflation factor (VIF) detects it.
-
Model assumptions: linearity (the relationship between X and Y is linear), independence (observations are not correlated with each other), homoscedasticity (the variance of residuals is constant), normality of residuals (residuals are approximately normal). Diagnostic plots — residuals vs. fitted values, Q-Q plots, Cook's distance — are the tools for checking these.
-
Logistic regression: for binary outcomes. The log-odds interpretation of coefficients. Why linear regression is inappropriate for binary outcomes (predictions outside [0,1], non-constant variance). Odds ratios and how to interpret them.
-
Interaction terms: a variable's effect may depend on the value of another variable. Including an interaction term (X₁ × X₂ as a predictor) models this. StatQuest's video on interaction terms in regression is particularly helpful.
Stage 5: Advanced Topics (Bayesian Statistics, Causal Inference, Non-Parametric Methods)
This stage is for people who need more than classical frequentist statistics — researchers, data scientists working on experiments, and anyone who wants to reason rigorously about causation rather than just correlation.
Bayesian statistics: the alternative to frequentist hypothesis testing. Instead of asking "what is the probability of this data given the null hypothesis?", Bayesian methods ask "what should I believe about the parameter given this data?" StatQuest has a growing series on Bayesian statistics. Ben Lambert's YouTube channel on Bayesian statistics is the most mathematically thorough treatment available on YouTube.
Causal inference: correlation is not causation, but causal inference is the set of tools for getting closer to causation from observational data. The potential outcomes framework (Rubin causal model), randomized controlled trials, propensity score matching, difference-in-differences, and regression discontinuity designs are the main methods. Nick Huntington-Klein's "The Effect" (a textbook with free online access) covers these, and his YouTube supplementary videos make the concepts concrete.
Non-parametric methods: tests that do not assume a specific distributional form. Mann-Whitney U test (non-parametric alternative to the two-sample t-test), Wilcoxon signed-rank test, Kruskal-Wallis test (non-parametric alternative to ANOVA). These are important when sample sizes are small and normality assumptions cannot be justified.
Survival analysis: for time-to-event data (time to death, time to customer churn, time to device failure). The Kaplan-Meier estimator and the Cox proportional hazards model are the standard tools. StatQuest covers both.
How to Actually Make Statistics Stick
Statistics is subject to a specific failure mode: you can follow every step of a derivation or explanation and feel like you understand it, then immediately fail to apply it to a slightly different problem. The concepts feel clear during the video and opaque an hour later.
This happens because of the distinction between recognition and recall. Watching a StatQuest video produces recognition — you follow the logic as it unfolds. Genuine understanding requires recall — you can reproduce the reasoning without prompts.
Techniques that work:
-
The Feynman technique applied to statistics: after watching a video on a concept, close your browser and explain the concept out loud (or in writing) as if teaching it to someone who has never seen it. You will find gaps immediately. Those gaps are where the learning happens.
-
Work problems by hand before using software: for any new statistical test, work through at least one example by hand (or at minimum, with a calculator). Compute the test statistic manually. Look up the critical value in a table. This makes the abstract machinery concrete in a way that software output never will.
-
Simulate in Python: for probability concepts, simulation is extraordinarily illuminating. Simulate the Central Limit Theorem: generate 10,000 samples from a skewed distribution, compute the mean of each, plot the distribution of means. Watch it converge to normal. This takes 5 lines of NumPy code and builds more intuition than an hour of watching videos.
-
Connect to real data: every statistical concept should connect to a real-world question you care about. P-values become tangible when you are testing whether a product change actually improved conversion rate. Regression coefficients become meaningful when you are trying to understand what drives customer lifetime value.
For capturing and reviewing statistics content from YouTube, the youtube-to-notes-complete-guide covers effective note-taking workflows for technical lectures, and the ai-study-notes-complete-guide covers tools that can help convert video transcripts into structured study materials.
Which Statistics YouTube Channels Are Best for Each Purpose?
StatQuest with Josh Starmer: best for building intuitive understanding of any statistical concept before going into mathematical depth. Start here for every new topic. The visual approach is uniquely effective for statistics, which is full of concepts that look meaningless as formulas but obvious as pictures.
3Blue1Brown: best for the mathematical intuition behind probability, the Central Limit Theorem, and Bayesian reasoning. Grant Sanderson's visual treatment of abstract mathematical objects (probability spaces, expected value as an integral) is unmatched.
zedstatistics: best for hypothesis testing and ANOVA with more mathematical rigor than StatQuest. Good for people who found StatQuest slightly too hand-wavy.
Brandon Foltz: best for regression analysis. His multi-hour series on simple and multiple linear regression is unusually thorough on the statistical details (F-statistics, degrees of freedom, coefficient interpretation) that most tutorials skip.
Krish Naik: best for applied statistics in a data science context — understanding how statistical tests connect to ML workflows, feature selection, and model evaluation.
How Statistics Connects to the Rest of Your Learning
Statistics does not exist in isolation. It is the theoretical foundation that justifies claims made from data, and it connects upward to machine learning (model evaluation, regularization, probabilistic models), downward to calculus and linear algebra (the math of regression and distributions), and outward to the specific domain you are working in.
For the machine learning connection specifically: the learn machine learning youtube roadmap covers how the statistical foundations built here (probability distributions, maximum likelihood estimation, Bayesian reasoning) connect to the algorithms used in production ML systems. The andrew-ng-ml-course-notes covers the classic treatment of these connections in Andrew Ng's teaching.
For the mathematical foundations that statistics builds on, the best YouTube channels for math guide covers the channels (3Blue1Brown, Professor Leonard, BlackPenRedPen) that handle calculus and linear algebra — both prerequisites for the more advanced parts of this statistics roadmap.
The learn data science from YouTube roadmap is the applied continuation of this statistics roadmap — showing how descriptive statistics, hypothesis testing, and regression are used in practice with pandas, scipy, and scikit-learn.
Is There a Right Age or Background to Start Learning Statistics?
No. Statistics is accessible to anyone who is comfortable with basic arithmetic and willing to think carefully. The mathematical prerequisites for the topics in Stage 1–3 are modest: you need to be comfortable with fractions, basic algebra, and the idea that a function describes a relationship between inputs and outputs. The more advanced stages (Stage 4–5) require calculus and linear algebra, but these can be learned in parallel.
What matters more than mathematical background is the willingness to think carefully about what numbers mean. Statistics is about reasoning under uncertainty, and reasoning under uncertainty requires slowing down and asking questions that most people skip: What am I assuming? How could this be wrong? What would change my conclusion?
Those habits are learnable. The YouTube channels in this guide are excellent teachers. The subject is genuinely important. The path forward is clear.
Statistics from YouTube is not a second-rate alternative to a university course — for most people, it is a better path because it lets you learn at the pace that suits your background, revisit confusing parts immediately, and connect the theory to real projects without waiting for a homework assignment.
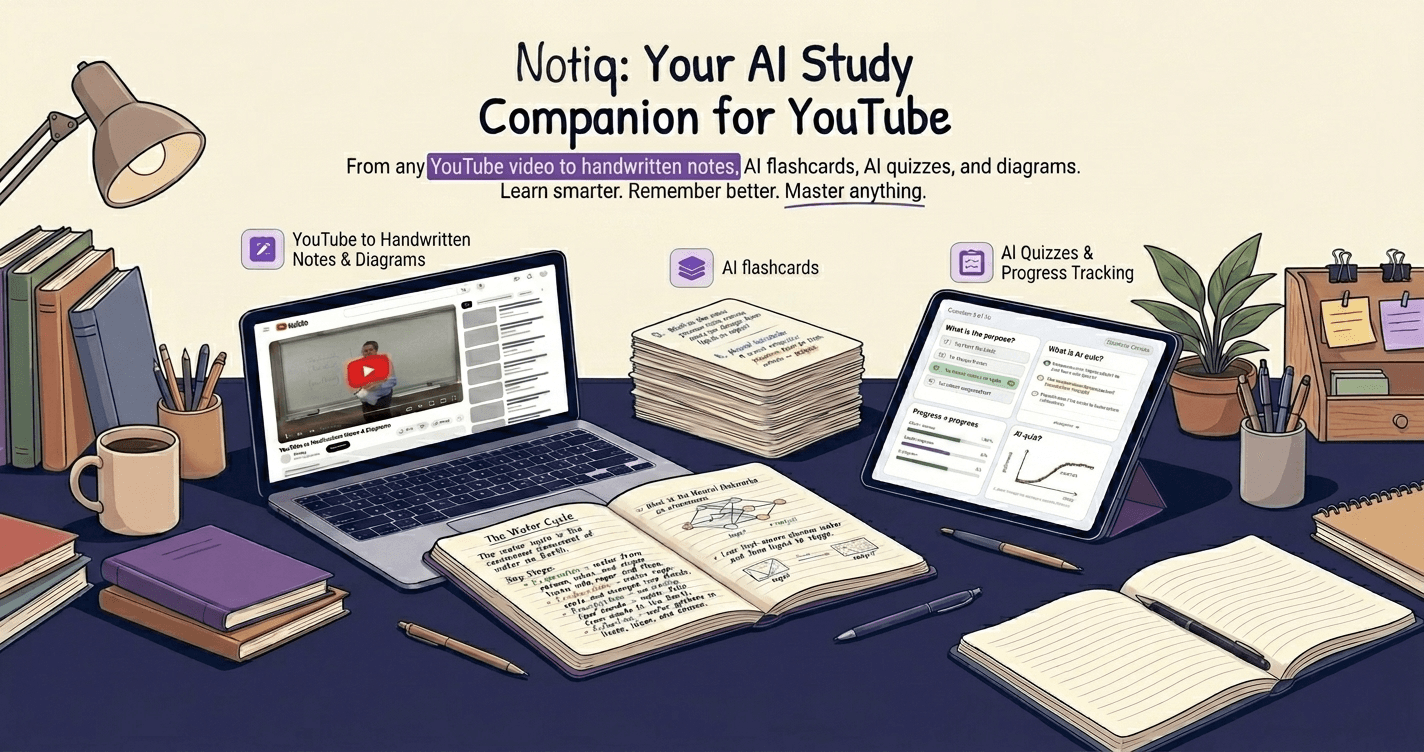
If you want to make your statistics study sessions more effective, Notiq turns any lecture transcript — StatQuest, 3Blue1Brown, or any statistics YouTube video — into structured notes with key concepts, formula explanations, and review questions. Try it free at notiq.study.